Profile

Data analyst who ships the reporting — and the tools behind it

PL-300 certified Senior Data Analyst & Power BI Developer with 4.5+ years owning BI end to end for US legal teams — from requirements with attorneys and case managers to deployed dashboards and automated reporting. A Gold Medalist in Biomedical Engineering, I bring scientific rigor to messy, high-volume medical, legal and insurance data: today that means turning it into the executive reporting attorneys decide on, and building the developer tools (DAX Workbench, DAX Architect, BI Visual Design) that make BI work faster and safer.

Skills

Power BI & BI

Power BI Desktop & ServiceDAXPower Query (M)Star SchemaBridge TablesRLSDrill-throughTableau

Databases & SQL

SQL ServerComplex JoinsCTEsStored ProceduresQuery OptimizationETL

AI & Automation

AI-Assisted Dev (Claude, ChatGPT, Gemini)LLM IntegrationOCR & NLPPrompt EngineeringDAG DesignCI/CD

Cloud & Azure

Power BI ServiceAzure AD (RLS)Azure SQLAzure Data Factory

Programming & Tools

Python (Pandas, NumPy)ReactTypeScriptFastAPIDockerGit

Not just dashboards

AI-Powered Tools

Developer tools I built for other BI developers — because I needed them and use them on real work.

Flagship toolPower BI External Tool · AI Delivery Platform · 2026

DAX Workbench

A Power BI External Tool that writes, proves and optimises DAX against your live model — and now runs a governed, verified AI delivery pipeline end to end.

A Power BI External Tool that launches from Desktop's own ribbon and works against the model you already have open, through a private .NET 8 bridge speaking TOM and ADOMD to the embedded Analysis Services engine. It turns plain-English intent into production-grade DAX, shows the real value from Microsoft's engine over the full data before anything is committed, rewrites slow measures and proves the gain by benchmarking both versions cold-cache, analyses VertiPaq storage, and maps every dependency so nothing is deleted that a report still uses. Around that tooling it now runs a full AI delivery platform: an 11-stage governed pipeline (the cockpit) that a Claude agent drives over a 19-tool MCP server — profile → star-schema model as TMDL → engine-validated DAX → report as PBIR → Git — behind human breakpoints and sign-offs, a folder-based registry of Claude Skills and pipeline templates, and verifying gates where the host re-computes the reconciliation baselines on the live engine before any stage goes green. The agent can drive, but it cannot open its own gates. One self-contained executable — nothing to install, and no data leaves the machine.

What it does

  • Turns plain-English intent into production-grade DAX, validated against the live schema so invented columns are impossible
  • Runs an 11-stage governed AI delivery pipeline: a Claude agent builds model + report as code behind human breakpoints and sign-offs
  • Verifying gates re-compute reconciliation baselines on the live engine — green means verified, never claimed
  • Reusable Claude Skills + pipeline templates: every lesson from one delivery is inherited by the next
  • Rewrites slow measures and proves the gain cold-cache; maps every dependency before anything is deleted
ReactTypeScriptZustandC# / .NET 8ADOMD / TOMMCPClaude Skills

Selected work

Projects

End-to-end Power BI solutions — from source data and modelling to secured, published reporting.

Supply Chain Control Tower

Power BI Report · 2026

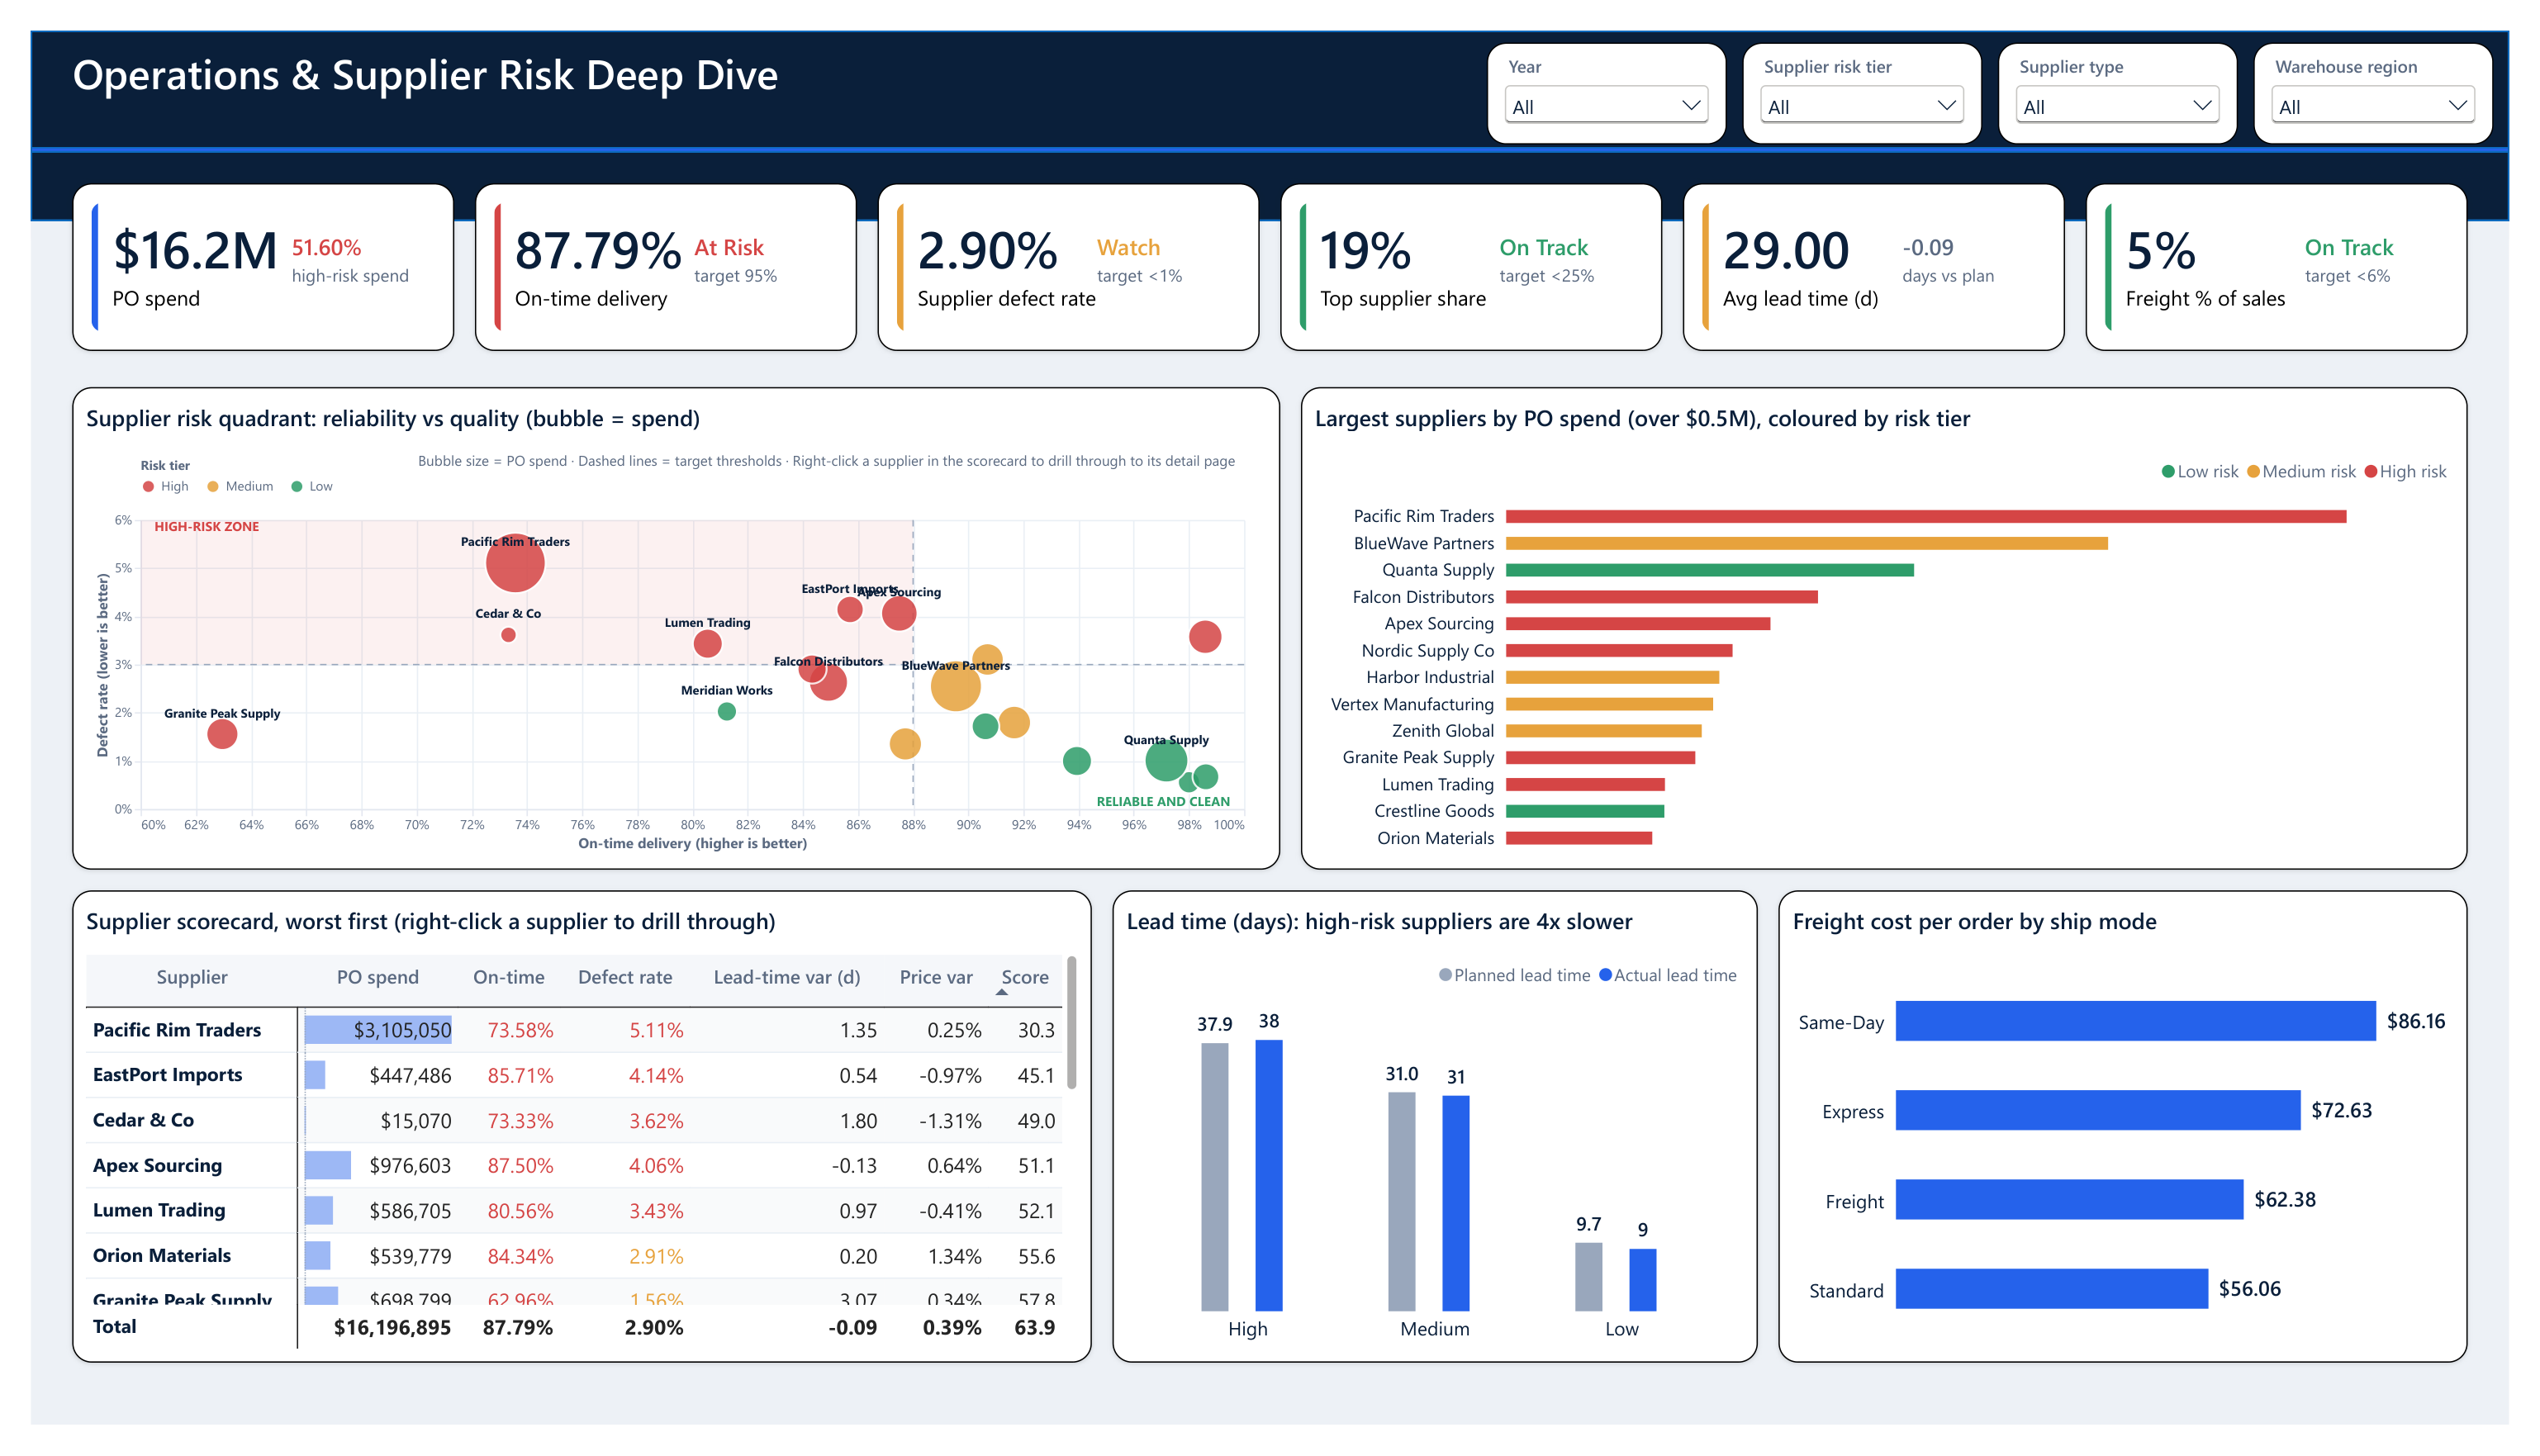
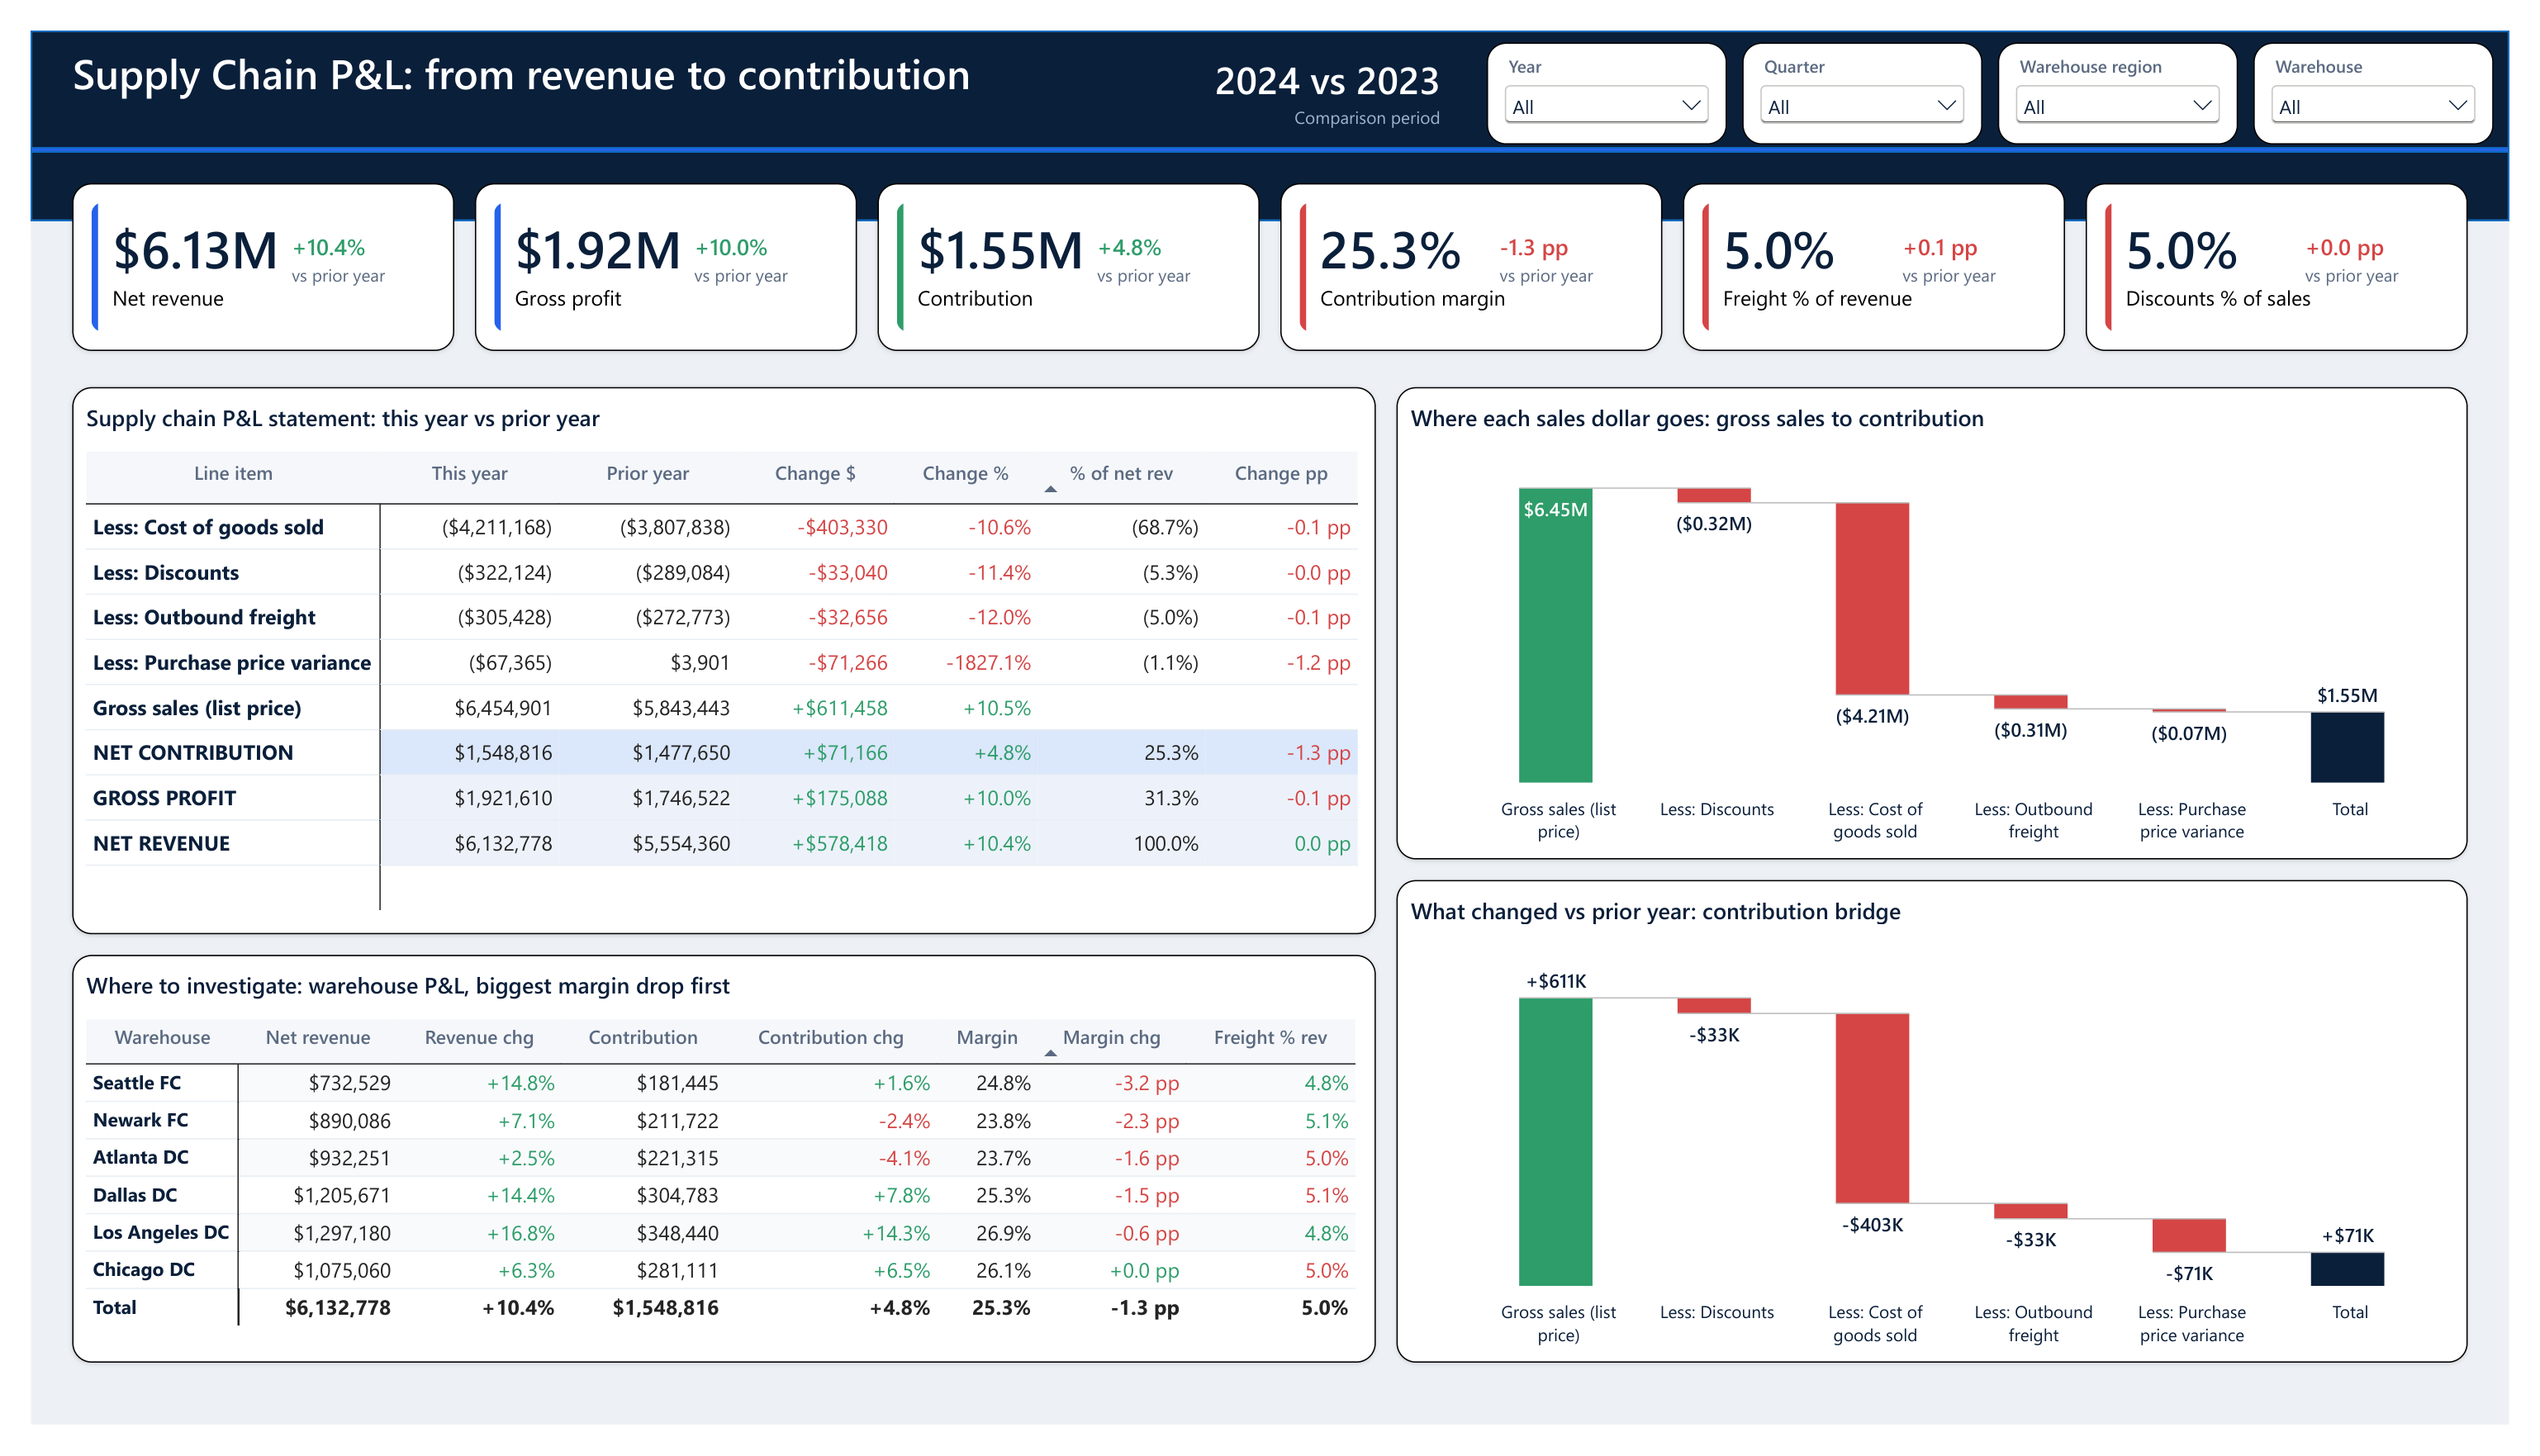
A five-page supply chain dashboard tying sales, shipments, inventory and supplier risk to profit.

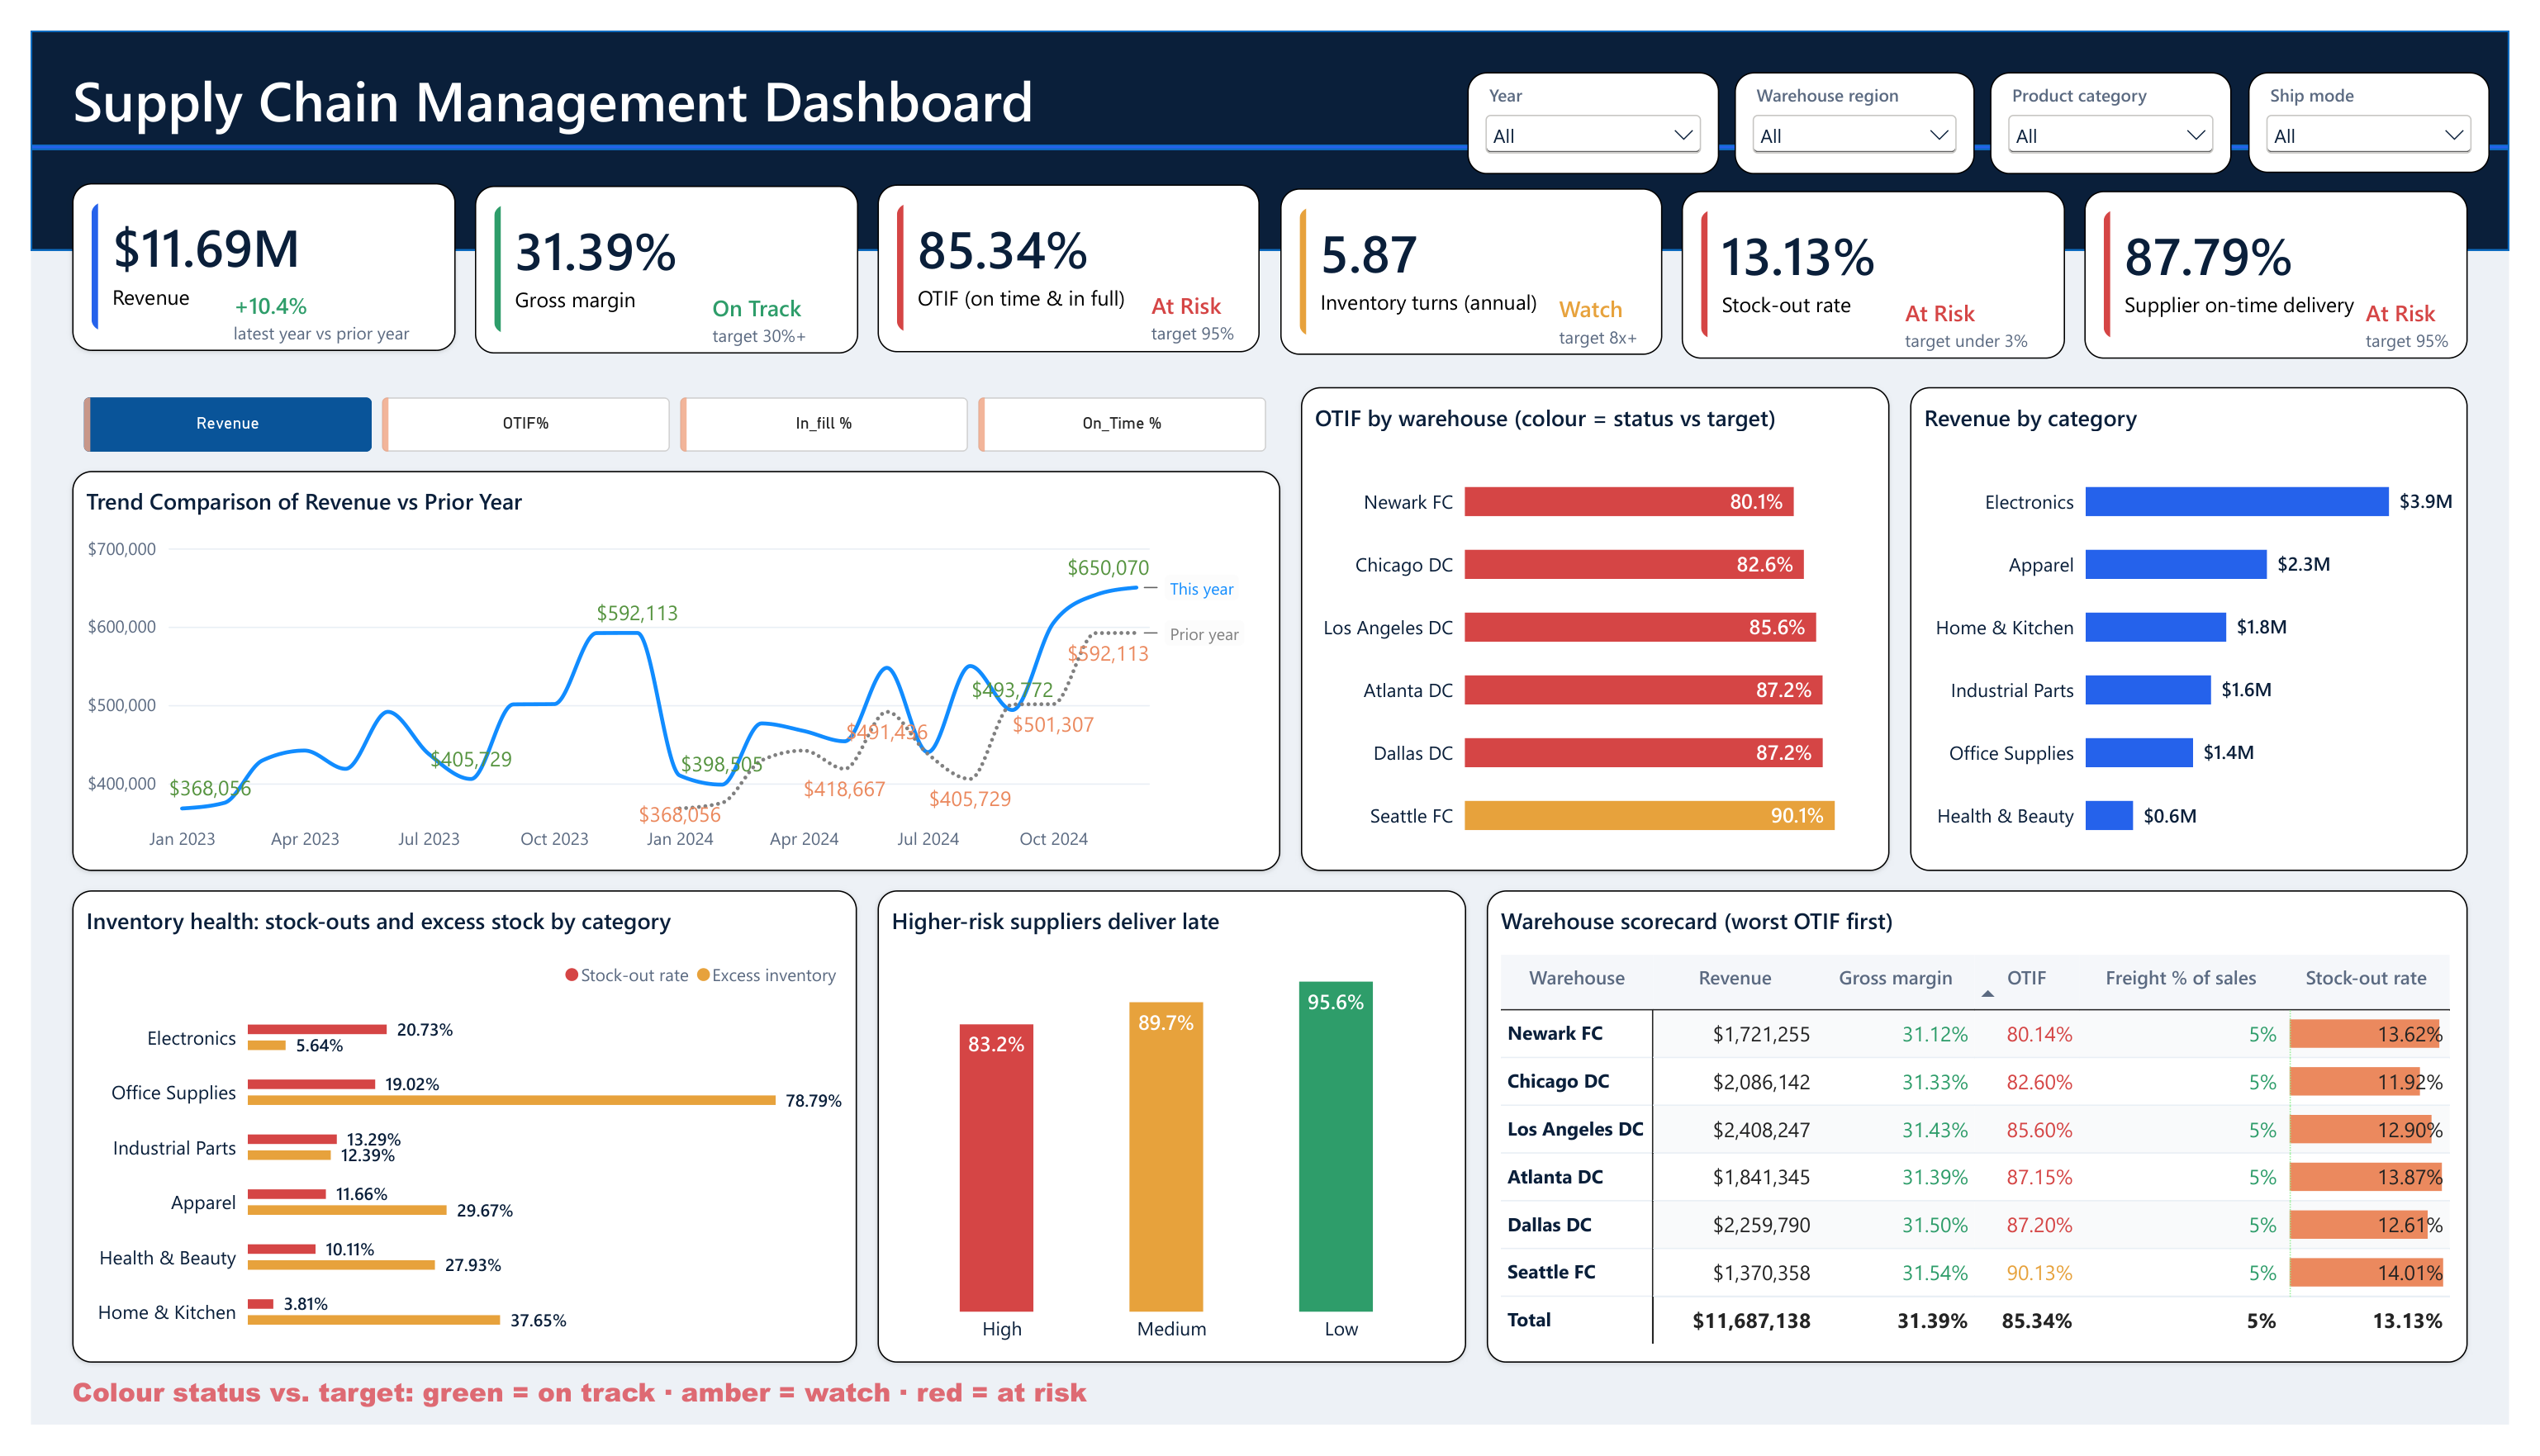
A Power BI model and report for supply chain performance, built on a star schema of four fact tables (sales, purchases, shipments, inventory) and five dimensions. 140+ DAX measures cover OTIF and fill rate, inbound on-time delivery, inventory turns and days-in-inventory, stock-out and excess/dead stock, purchase price variance, freight cost, and supplier concentration. A risk layer links supplier risk tiers to the revenue they expose, so a late or defective supplier shows up as money at stake. Five pages: Executive Control Tower, Operations & Supplier Risk, Supplier Scorecard, Warehouse Snapshot and a Supply Chain P&L with a dynamic line selector. Built in the source-control-friendly PBIP / TMDL format. Synthetic data only.

Power BIDAXPBIP / TMDLPower Query (M)Star SchemaTime Intelligence

AI Services Delivery Analytics

Power BI Report · built by DAX Workbench · 2026

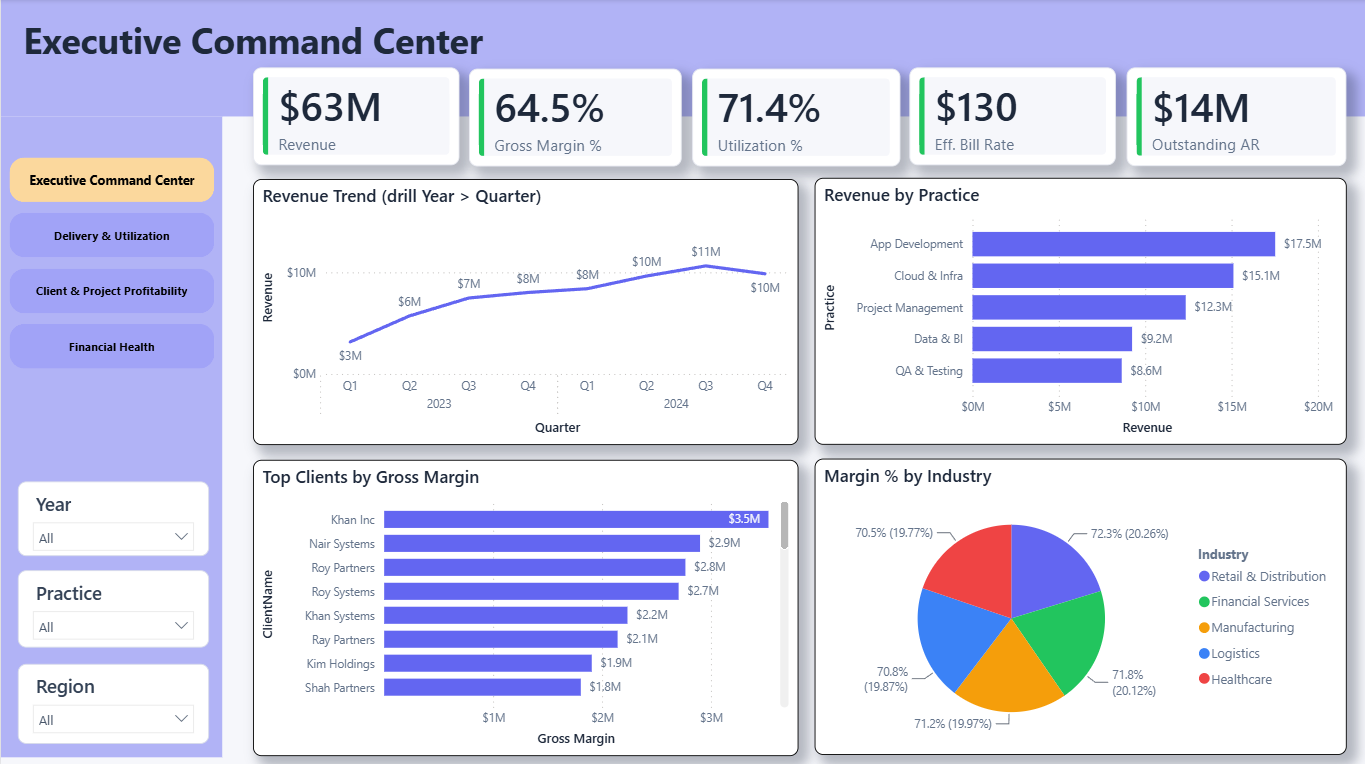
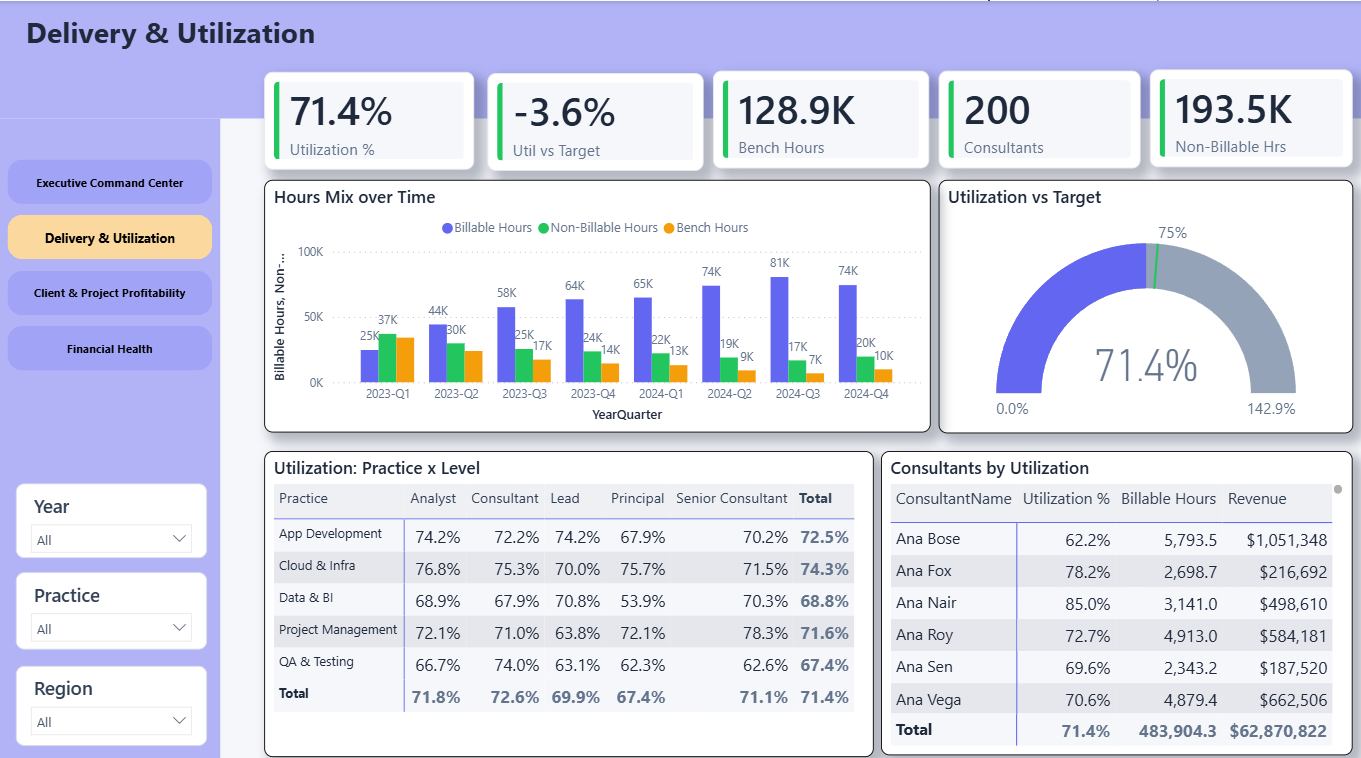
A four-page delivery-intelligence report designed and produced end to end by my DAX Workbench pipeline — finished by hand.

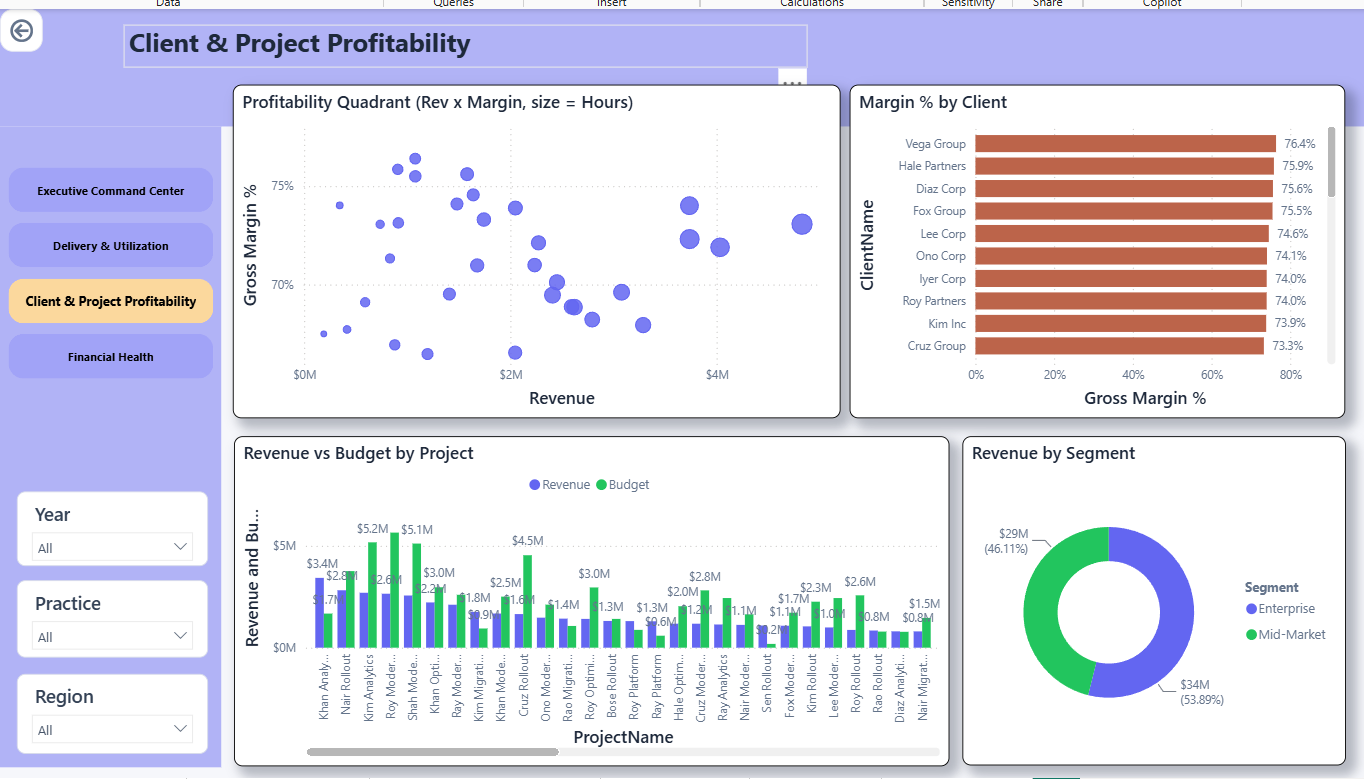
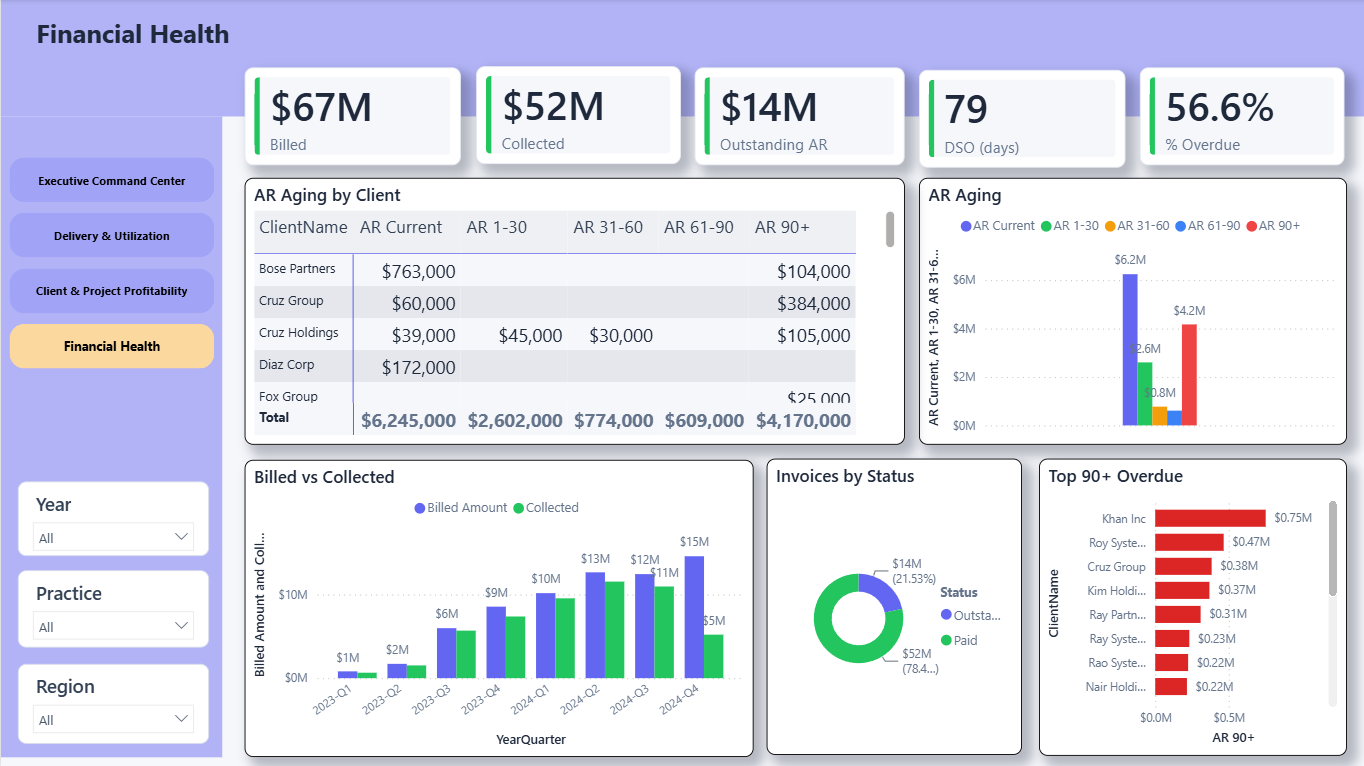
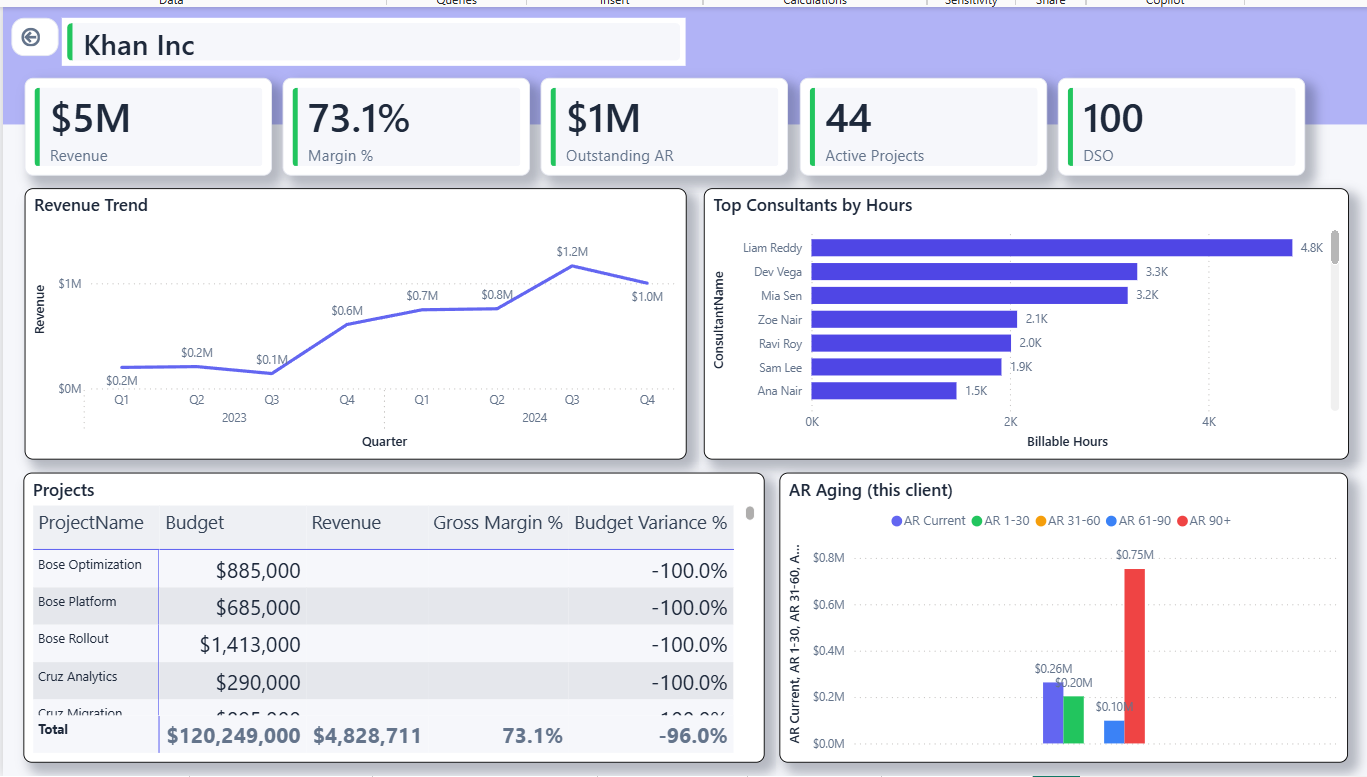
A professional-services dashboard (utilization, margin, collections, project economics) whose entire build ran through my DAX Workbench delivery pipeline: a Claude agent profiled the raw CSVs, designed the star schema, authored the semantic model as TMDL through the Power BI modeling MCP, wrote 37 measures that were each validated on the live engine, and generated the report as PBIR code — with me holding approval gates at every consequential step and applying the final visual polish by hand. Every headline number was re-computed on the engine by the pipeline's verifying gates and reconciles with the source files exactly (Revenue $62,870,822, to the penny; the AR aging buckets sum precisely to Outstanding). Ships with dynamic multi-role row-level security (Admin / Region / Practice, deny-by-default) added later as a governed change request, a Client-360 drill-through, and documentation generated from the model itself — the whole project lives in Git as PBIP.

Power BIPBIP / TMDLPBIRDAXClaude + MCPDynamic RLS

MSP Management Accounts

Power BI Report · 2026

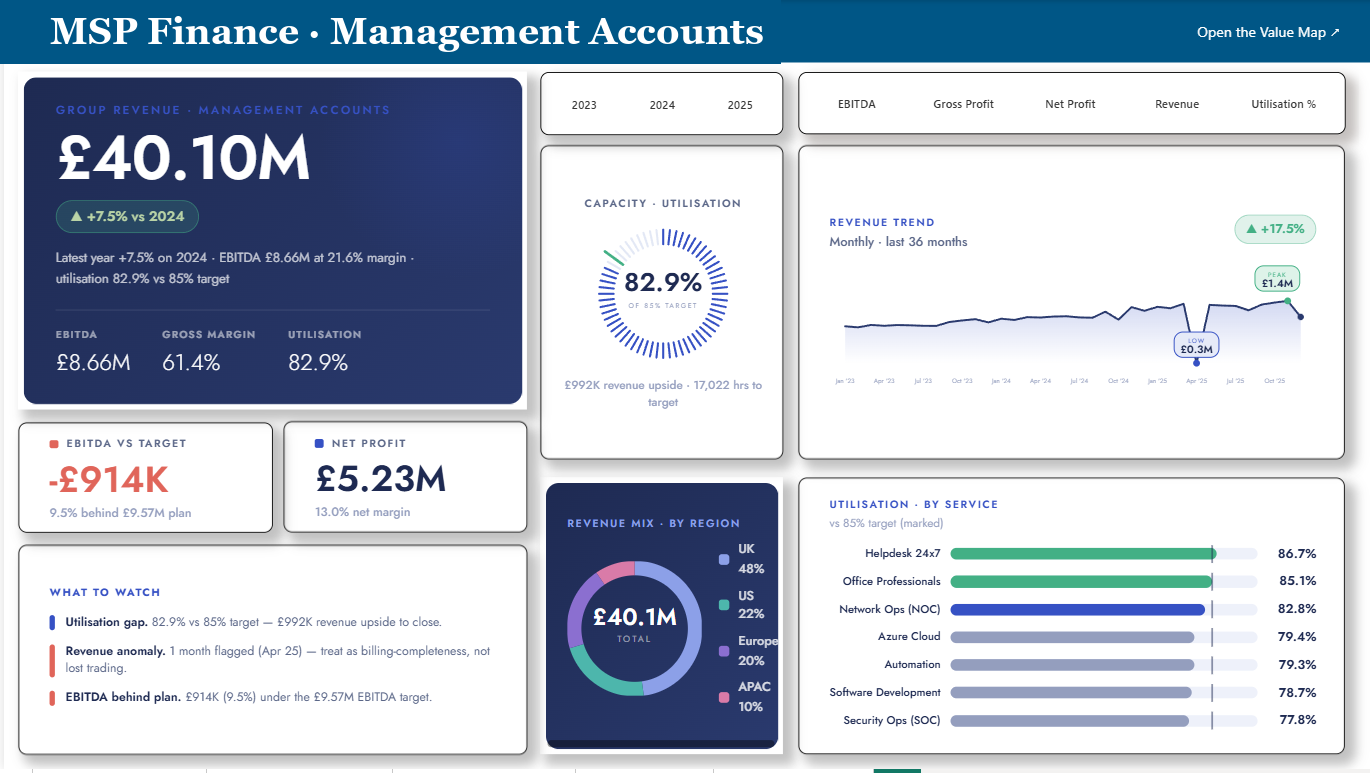
A board-ready finance dashboard where every number reconciles to the audited accounts.

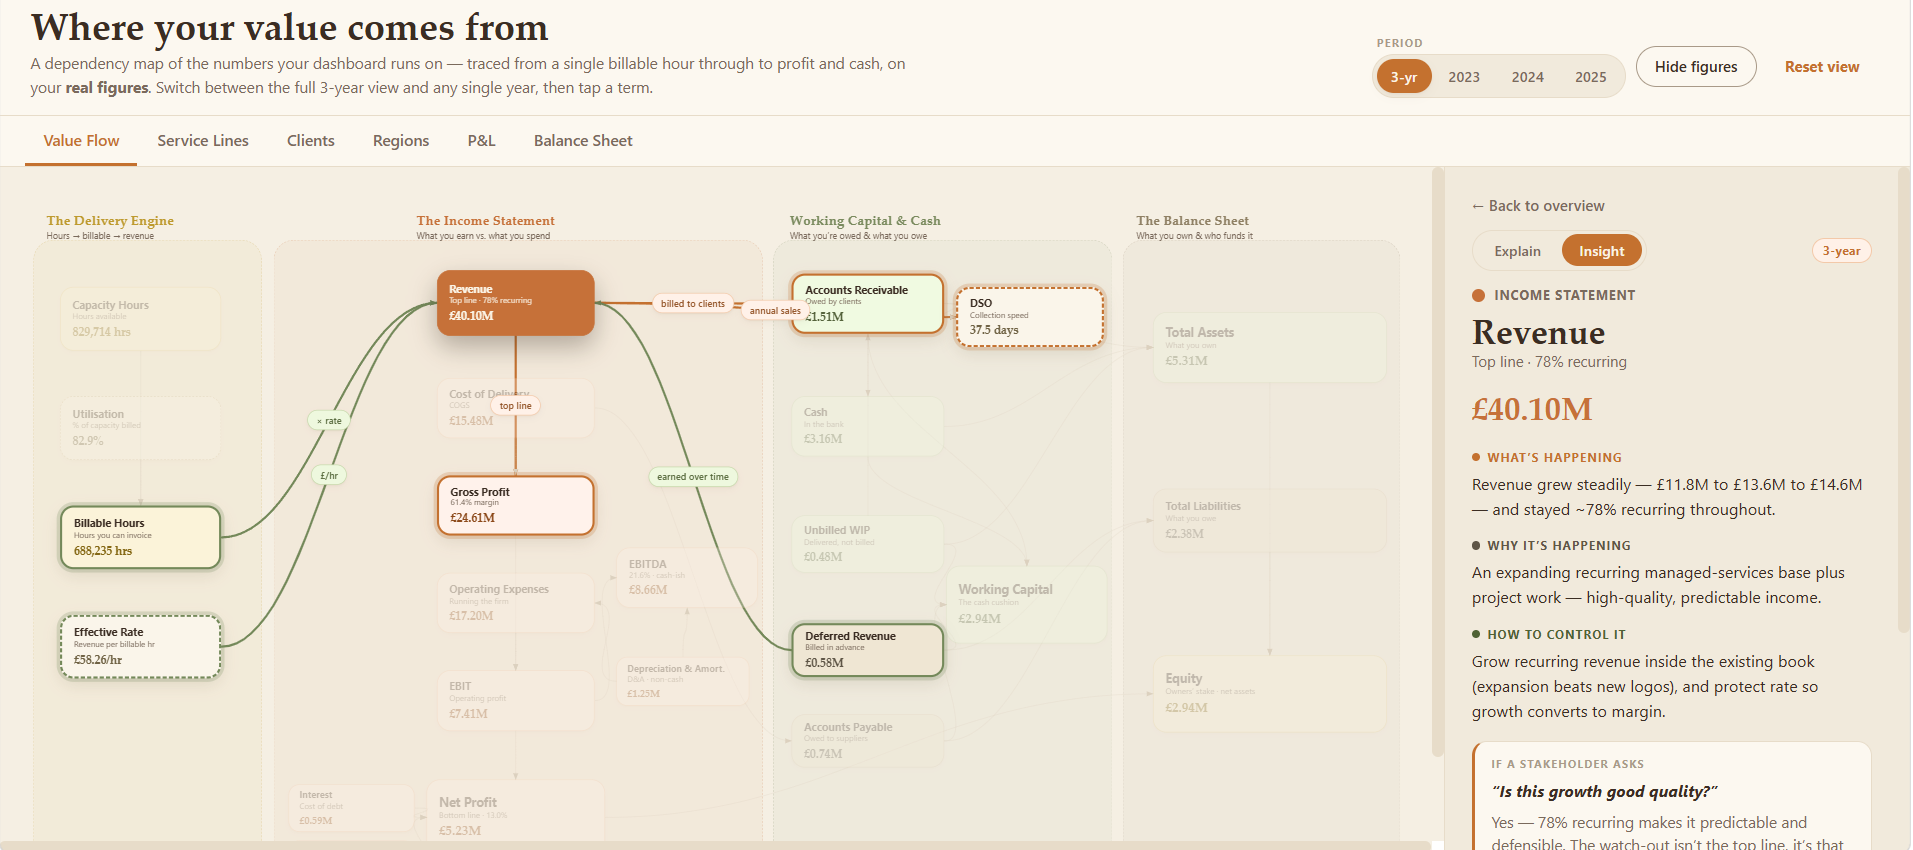
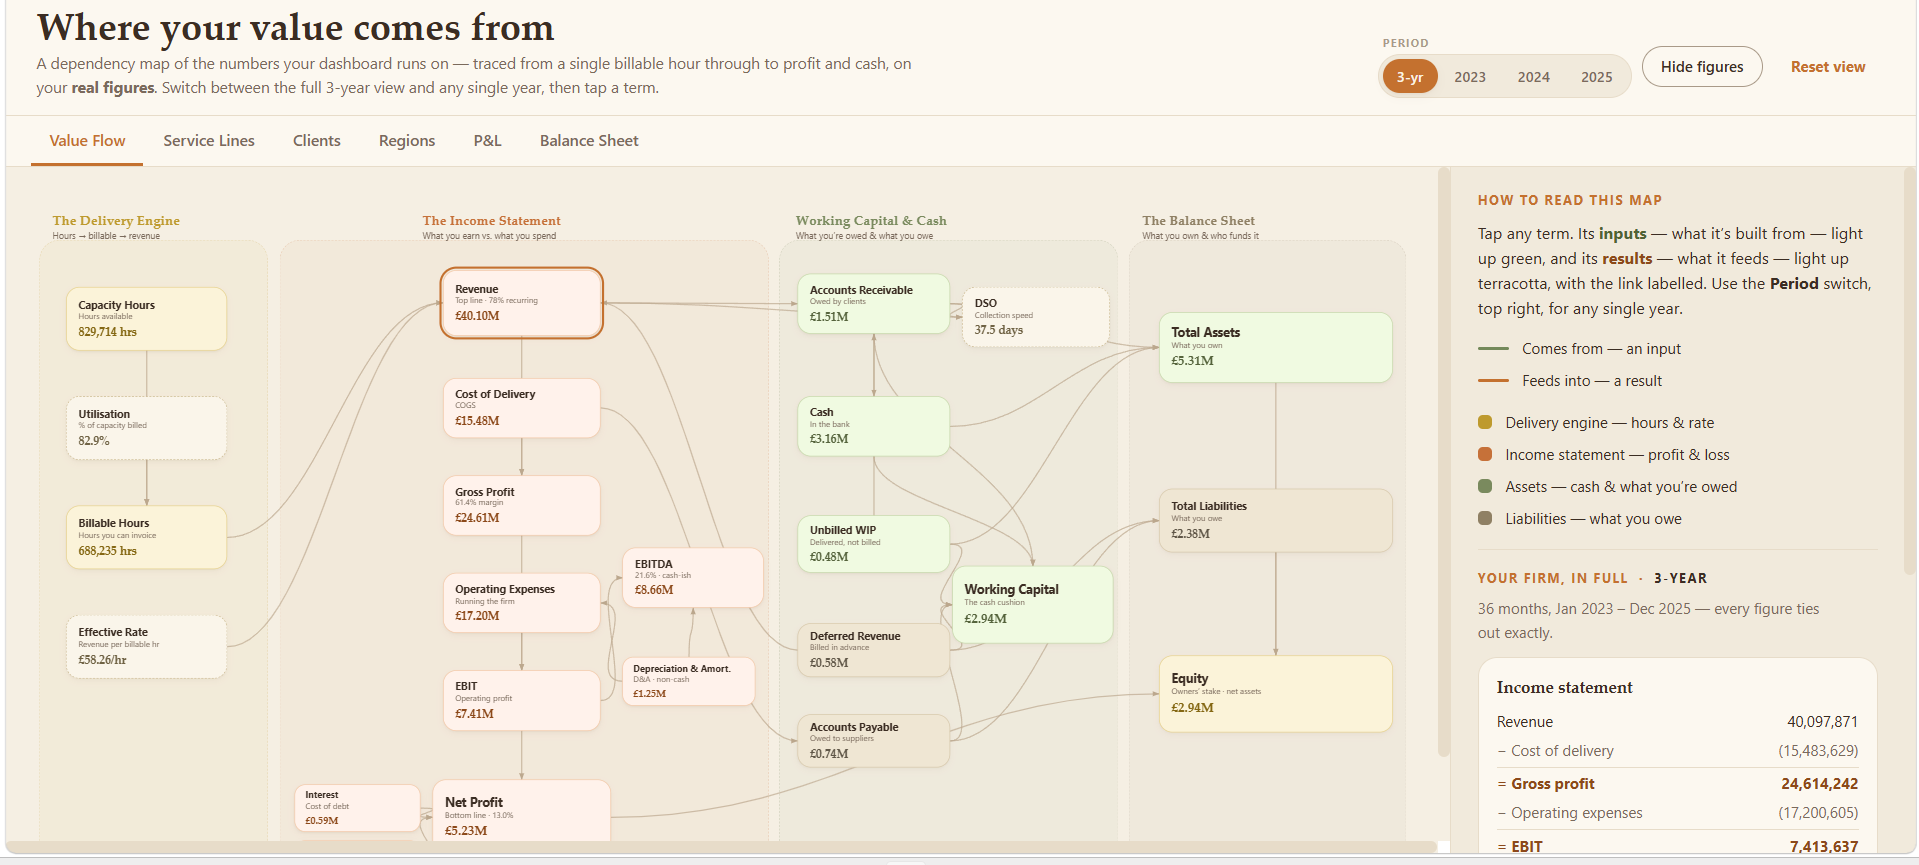
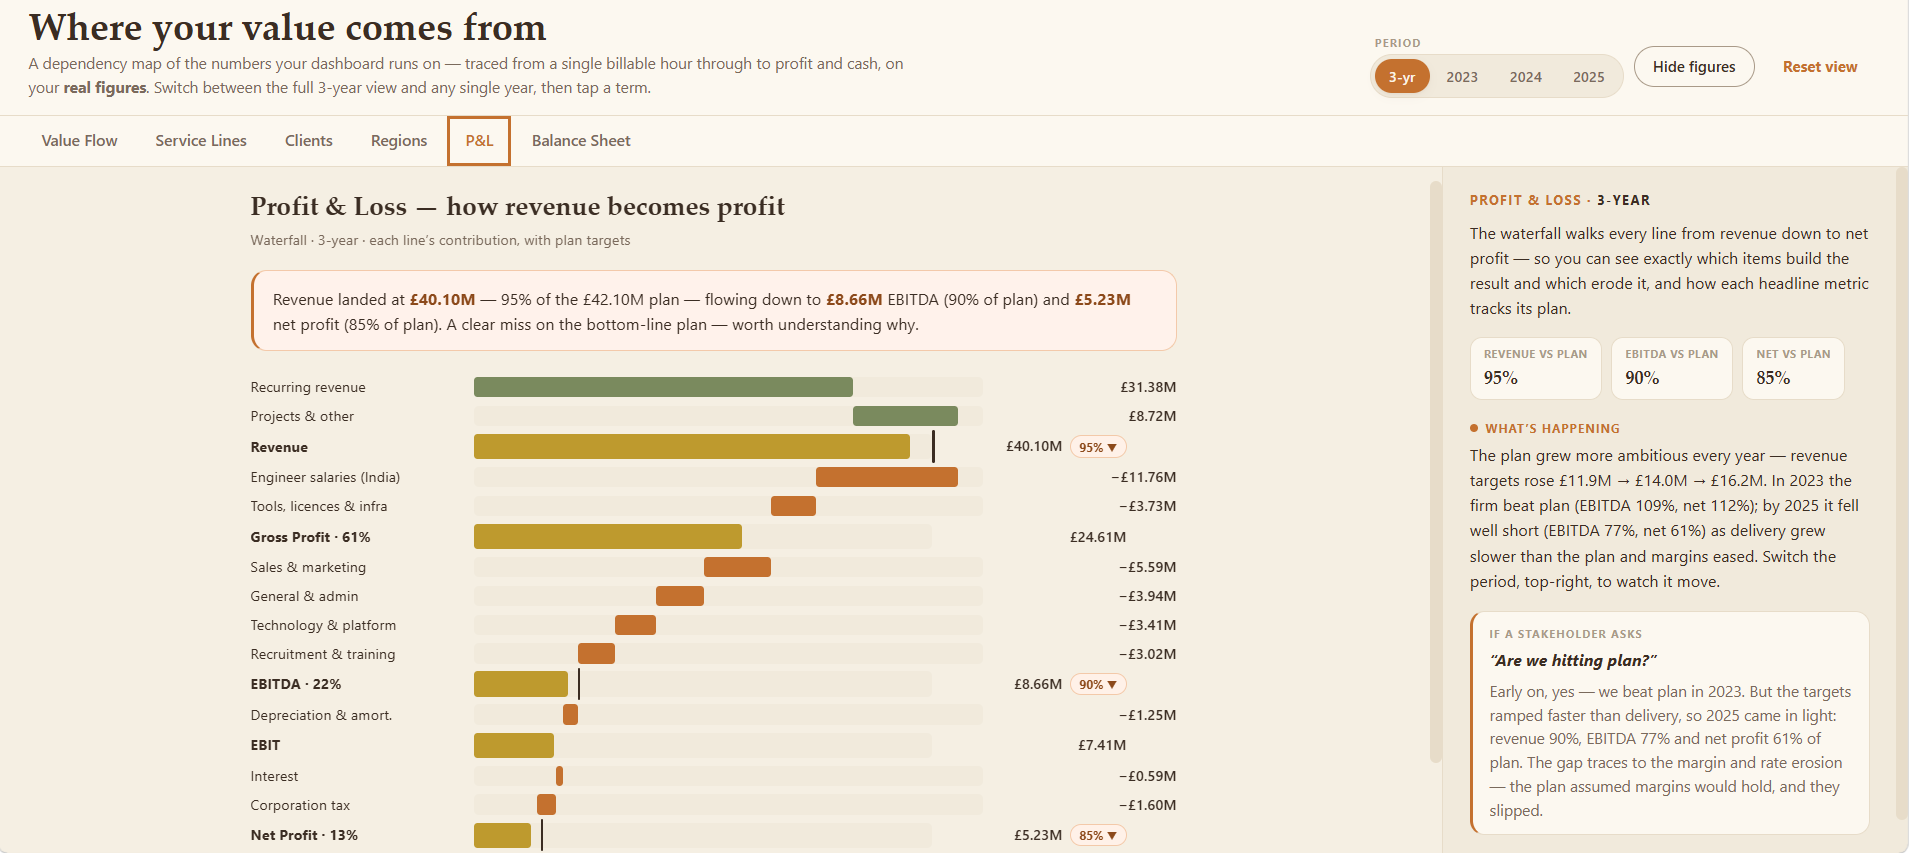
A Power BI finance model for a Managed Service Provider that unifies billing hours, P&L and the balance sheet into one board-ready board — where every client, service and month ties back to a single audited revenue total (~£40M across 36 months). Where per-account revenue isn't reliable, the audited P&L is split by each account's share of billable value and cost by its share of actual delivery cost, so margins vary realistically. Includes semi-additive balance-sheet measures, a sign-convention P&L, common-size analysis, Row-Level Security and full time intelligence (YoY, MoM, fiscal YTD, rolling 12-month). Built in the source-control-friendly PBIP / TMDL format. Synthetic data only.

Power BIDAXPBIP / TMDLPower Query (M)RLSStar Schema

Medical-Legal Claims Analytics

Power BI Report · 2025

End-to-end Power BI solution on medical-legal data, secured with dynamic RLS.

A complete BI solution built on synthetic medical-legal data: SQL Server views and stored procedures → Power Query ETL → a star schema with a bridge table → 40+ DAX measures → 6 report pages plus an executive dashboard, published to Power BI Service. Advanced DAX includes time intelligence, RANKX leaderboards, an Nth-largest-value measure driven by a disconnected parameter table, and a dynamic measure selector. USERPRINCIPALNAME()-based row-level security means each law firm sees only its own data — scalable to new firms with zero model changes.

Power BIDAXSQL ServerPower QueryRLSStar Schema

Career

Experience

Senior Data Analyst & Power BI Developer · Jacoby & Meyers · Bolster Legal

Dec 2022 — Present

US Medico-Legal Firm · Remote (India)

  • Built and own 14+ interactive Power BI dashboards on Azure-hosted Power BI Service covering case pipelines, billing and settlement value, insurance-claim outcomes and firm performance — improving operational visibility by ~40%.
  • Modelled 500+ active cases as star schemas with advanced DAX (time intelligence, RANKX, dynamic measures) and Azure AD row-level security so each firm sees only its own data.
  • Engineered SQL Server + Power Query ETL from databases, APIs and FTP into centralized analytical datasets with scheduled refresh.
  • Built the firm's internal AI-assisted automation suite — medical-bill extraction, document assembly and schema-driven code generation — cutting manual reporting and review work by up to 60%.
Power BIDAXAzureRLSSQLAutomation

Claims Analyst — Team Lead · Amable Consultancy Services Pvt. Ltd

Aug 2021 — Nov 2022

Mohali, India

  • Led a team of 5 analysts processing and validating insurance-claims data at 99%+ accuracy and full regulatory compliance.
  • Built reporting for claim-volume tracking, TAT analysis and financial reconciliation using advanced Excel (VLOOKUP, INDEX-MATCH, PivotTables).
  • Streamlined data-quality processes, cutting error rates by 35% and improving processing turnaround.
Excel / VBAData ValidationTeam LeadReporting

Contact

Let's turn your data into decisions

I'm open to Power BI Developer roles and interesting data / BI-tooling problems. The fastest way to reach me is email or LinkedIn.

Email me